Image gallery
CLAWS - Hydrodynamics
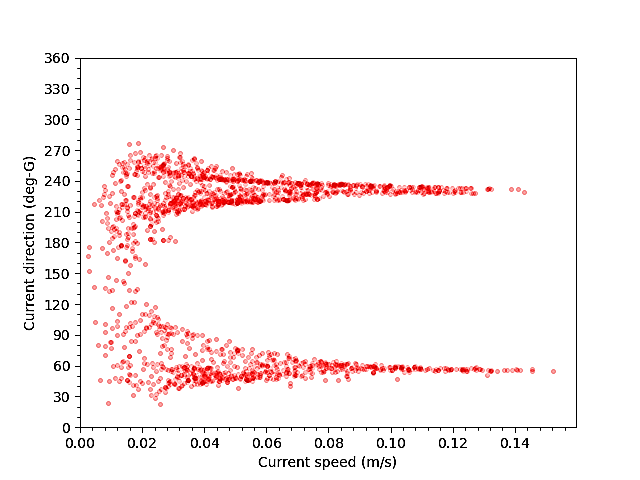
Current speed versus direction for the hydrodynamic model near Little Colonsay. Data is for the period of 80 days from the 4th July - 20th September 2021. [PDF→]
CLAWS - Hydrodynamics
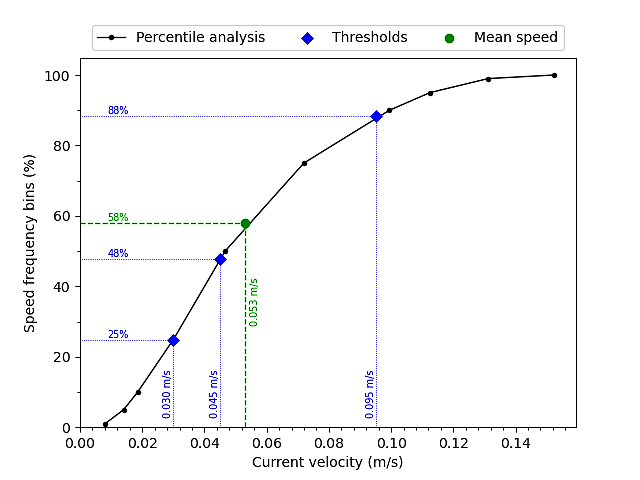
Current speed percentile data for the hydrodynamic model. Data is near Little Colonsay for the period of 80 days from the 4th July - 20th September 2021. [PDF→]
CLAWS - Bath Treatments
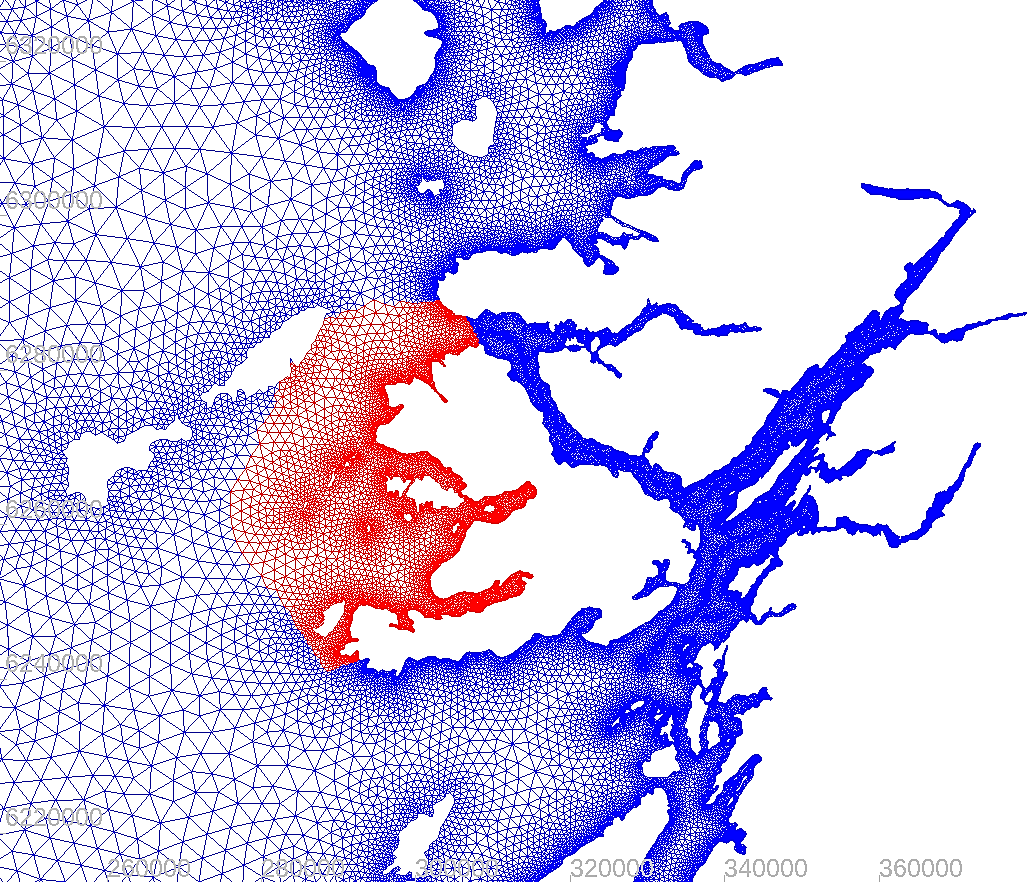
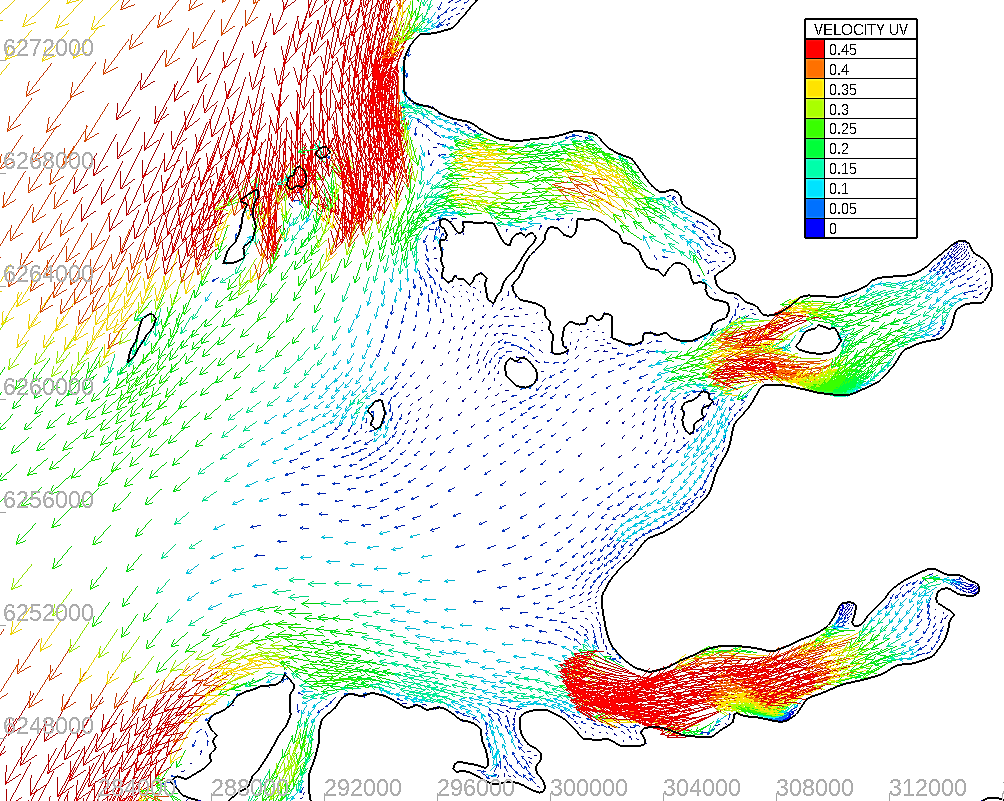
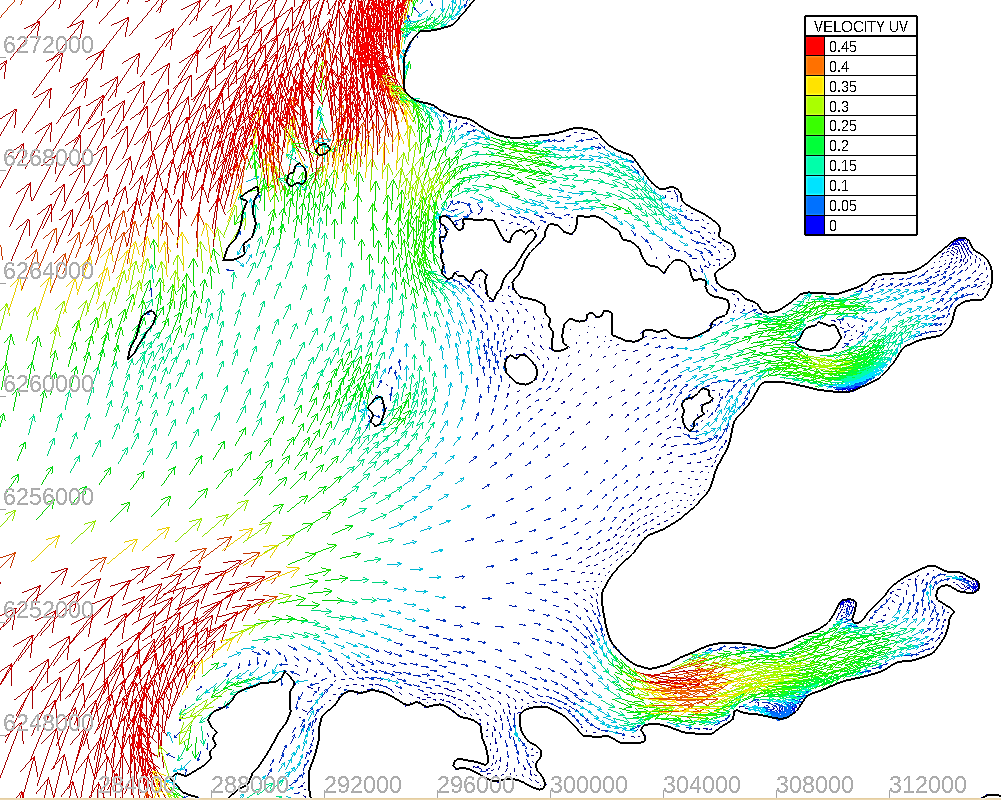
Zoomed view of original Telemac 3D hydrodynamics mesh and reduced size model used for the pesticide dispersion. [PDF→]
CLAWS - Bath Treatments
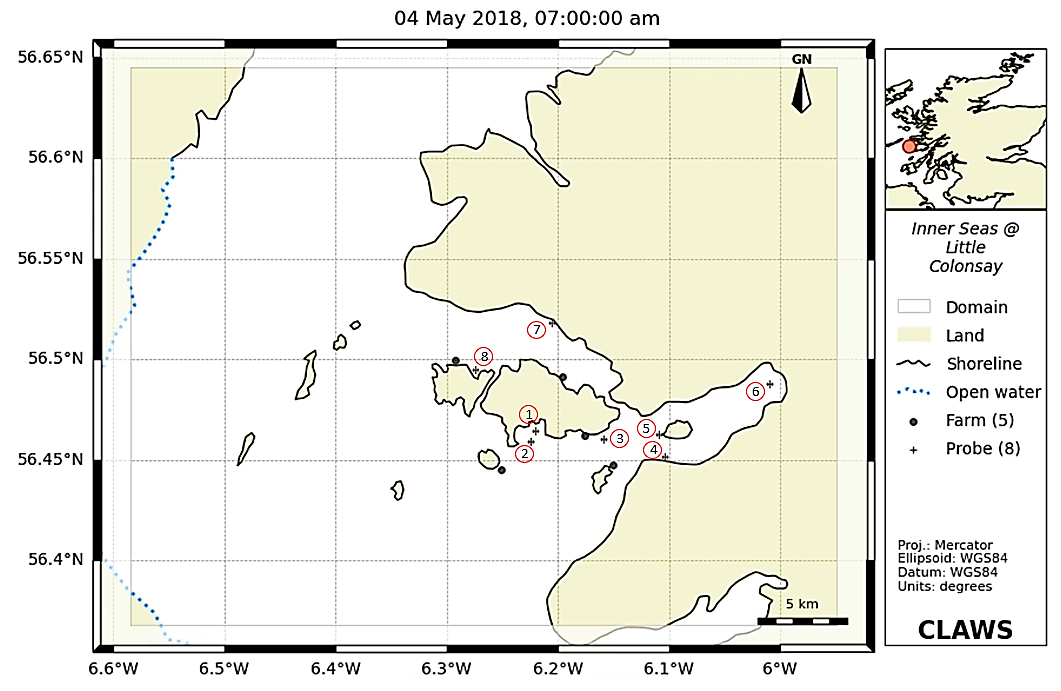
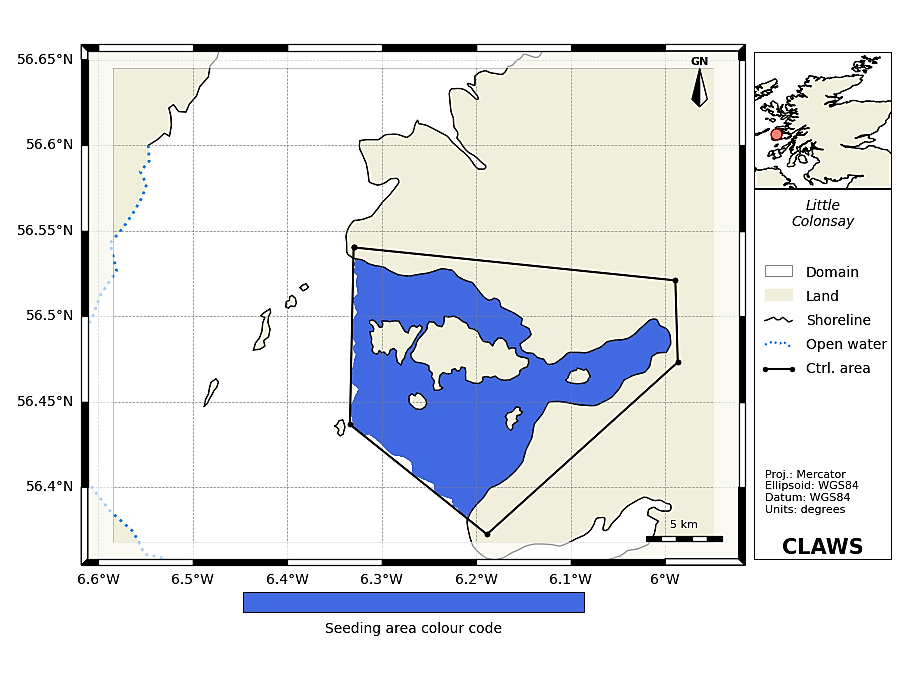
Locations of virtual probes to measure Azamethiphos concentrations across the inner seas around Little Colonsay. Half-life of Azamethiphos = 8.9 days. [PDF→]
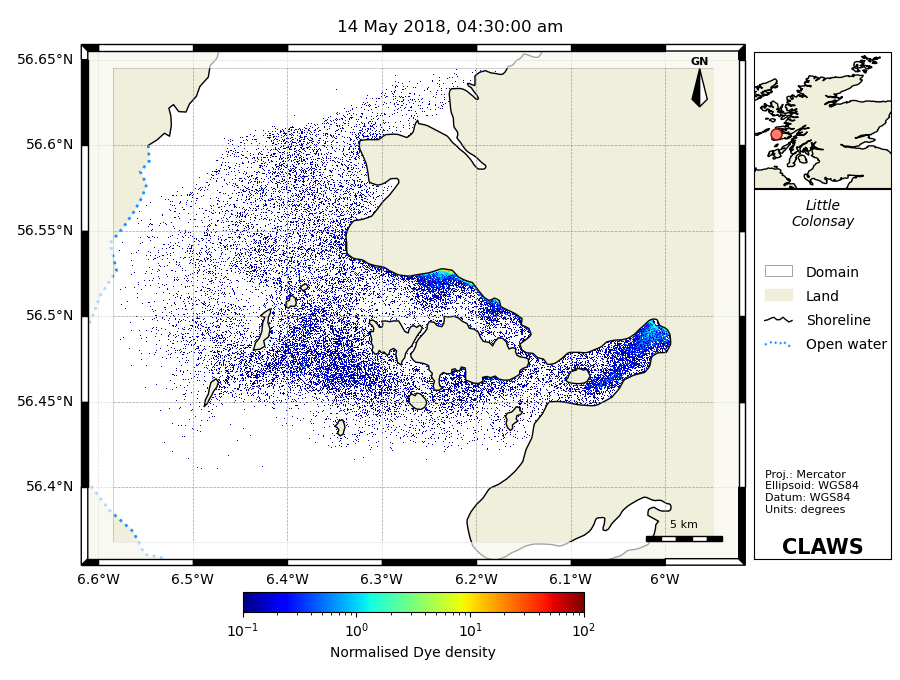
CLAWS - Bath Treatments
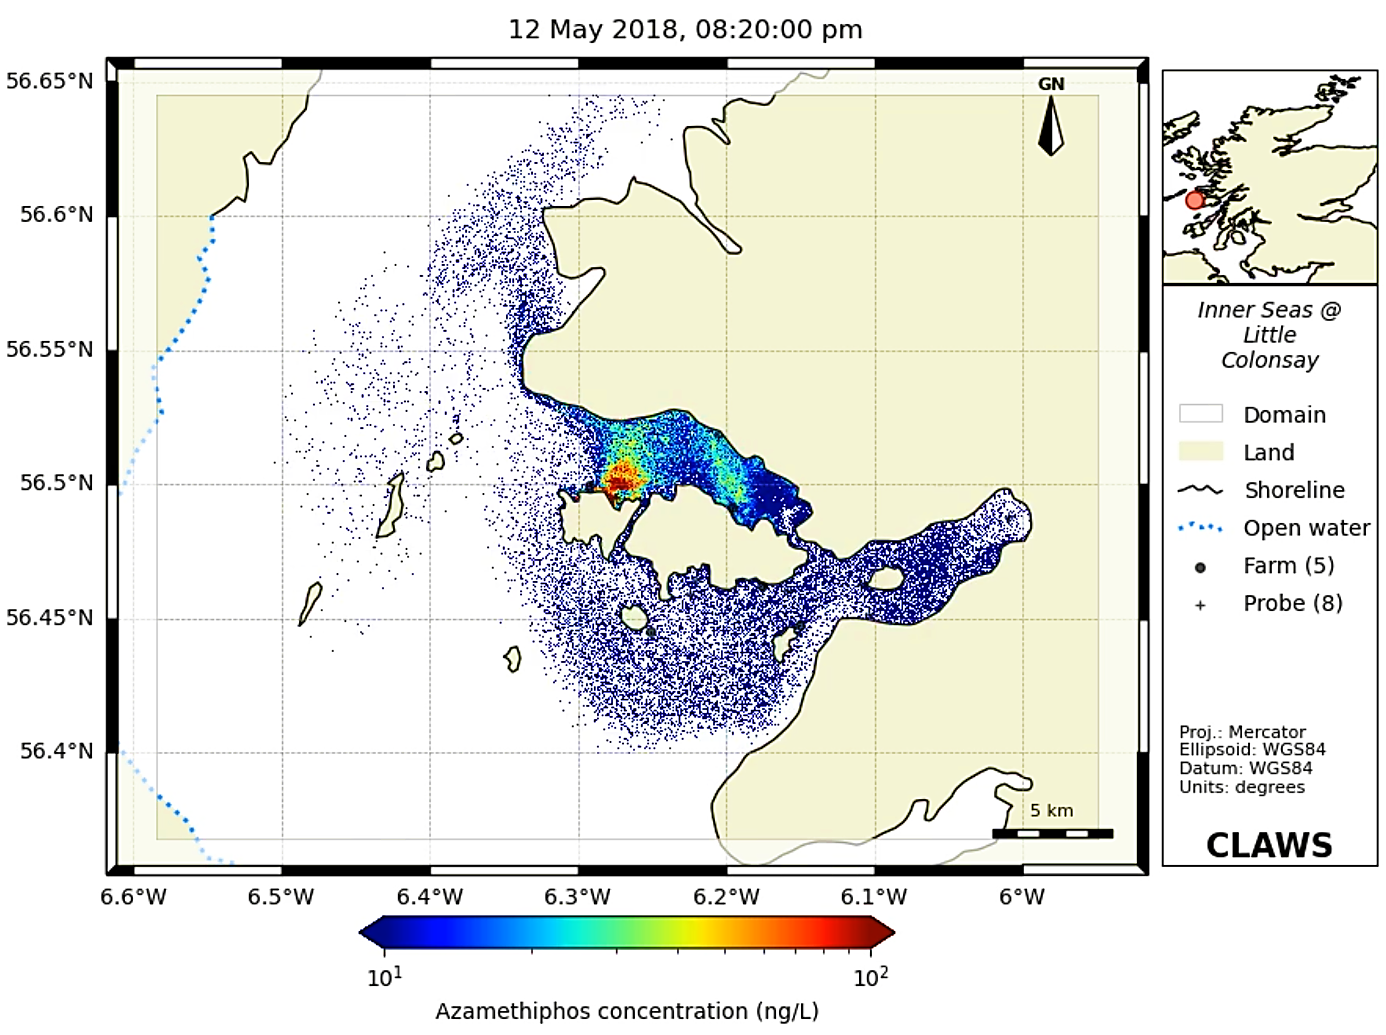
Snapshots of Azamethiphos dispersion in the Little Colonsay system. Half-life of Azamethiphos = 8.9 days. [PDF→]
CLAWS - Bath Treatments
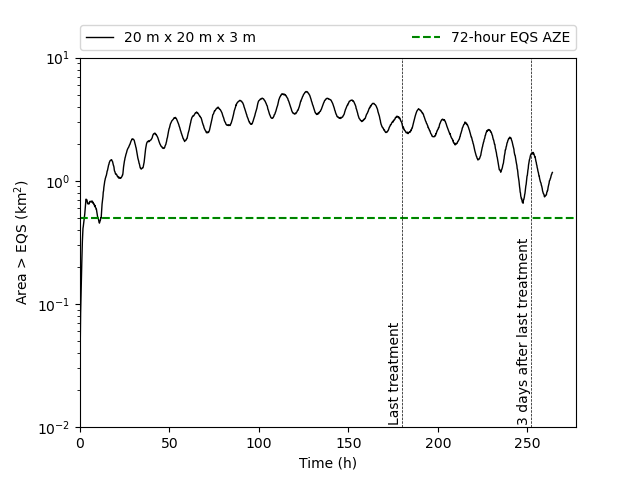
Plot of area (km2) exceeding the SEPA EQS (40 ng/L) for Azamethiphos. The SEPA requirements state that this area must not exceed 0.5 km2. Half-life of Azamethiphos = 8.9 days. [PDF→]
CLAWS - Bath Treatments
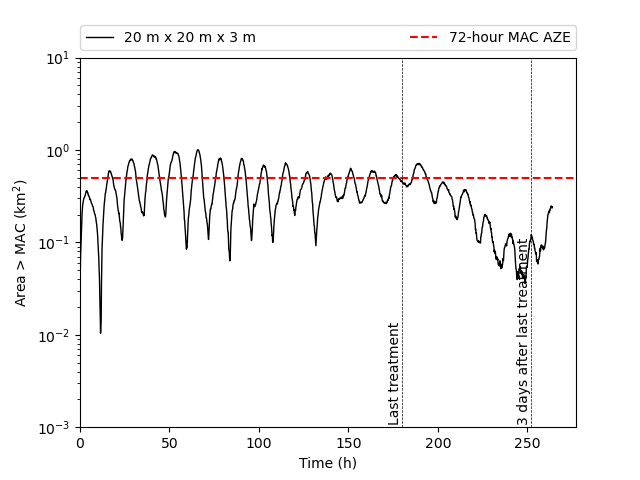
Plot of area exceeding the SEPA MAC (100 ng/L) for Azamethiphos. The SEPA requirements state that this area must not exceed 0.5 km2. Half-life of Azamethiphos = 8.9 days. [PDF→]
CLAWS - Bath Treatments
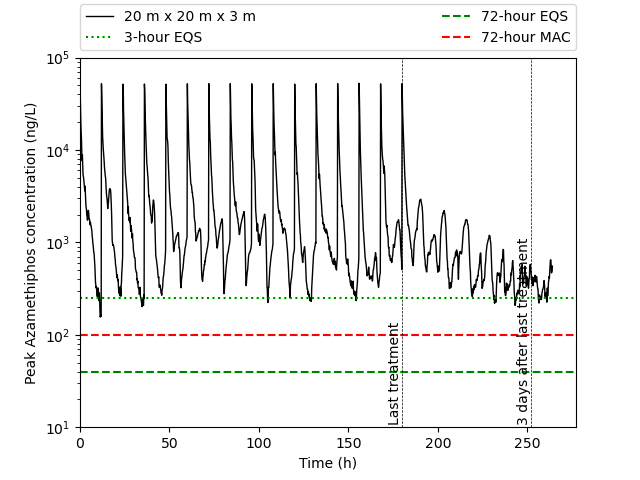
Peak Azamethiphos concentration anywhere on the 20 m × 20 m × 3 m sampling grid. Half-life of Azamethiphos = 8.9 days. [PDF→]
CLAWS - Nutrients
Random initial particle generation within the bounds of the json control area in CLAWS. [PDF→]
CLAWS - Nutrients
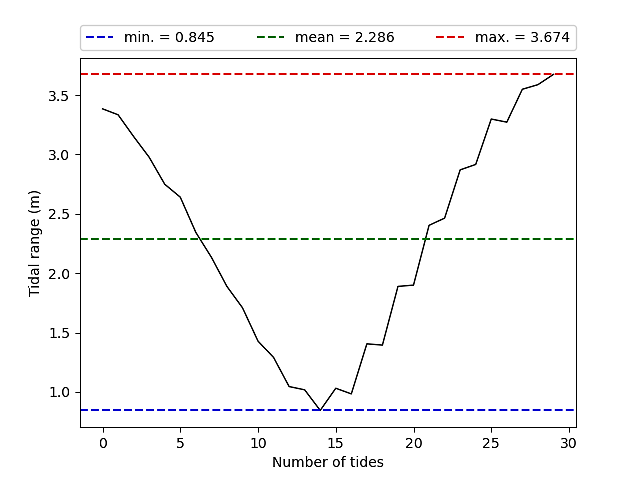
Tidal range (m) graph at the proposed farm location for the period 2nd - 19th May 2018. [PDF→]
CLAWS - Waste
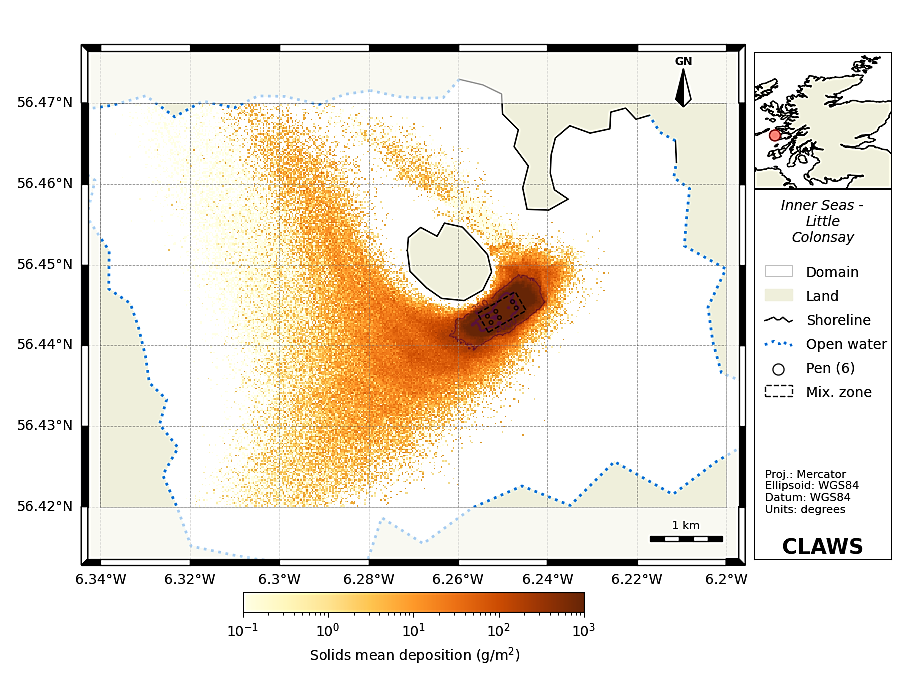
Waste solids mean deposition footprint for the proposed farm at Little Colonsay. Values correspond to the average sea bed deposition over 90-days from 1st March - 31st May 2019. [PDF→]
CLAWS - Waste
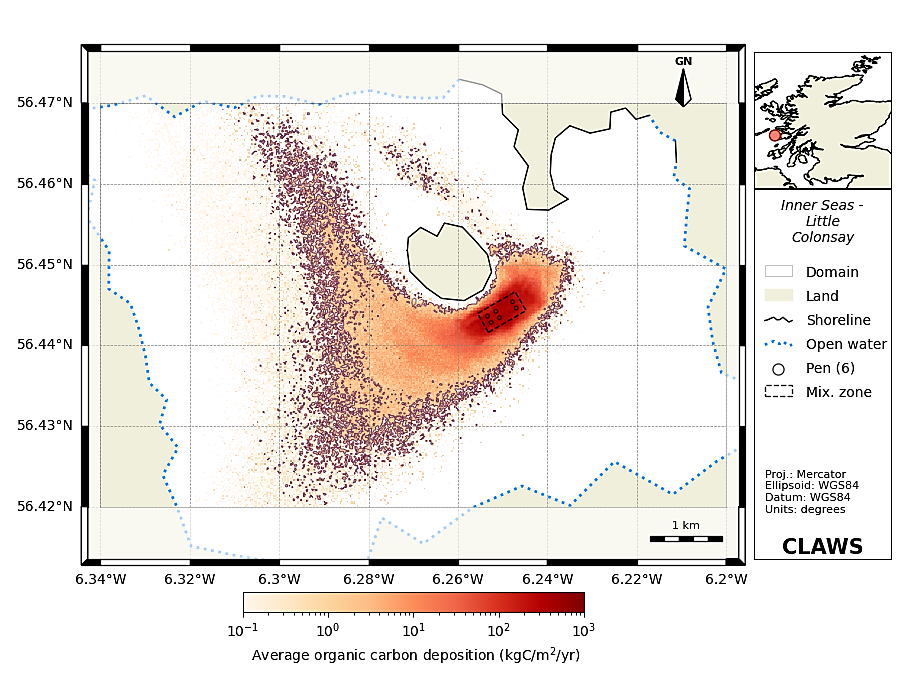
Footprint area of particulate organic carbon for the proposed farm at Little Colonsay. Values correspond to the average sea bed deposition over 90-days from 1st March - 31st May 2019. [PDF→]
CLAWS - Waste
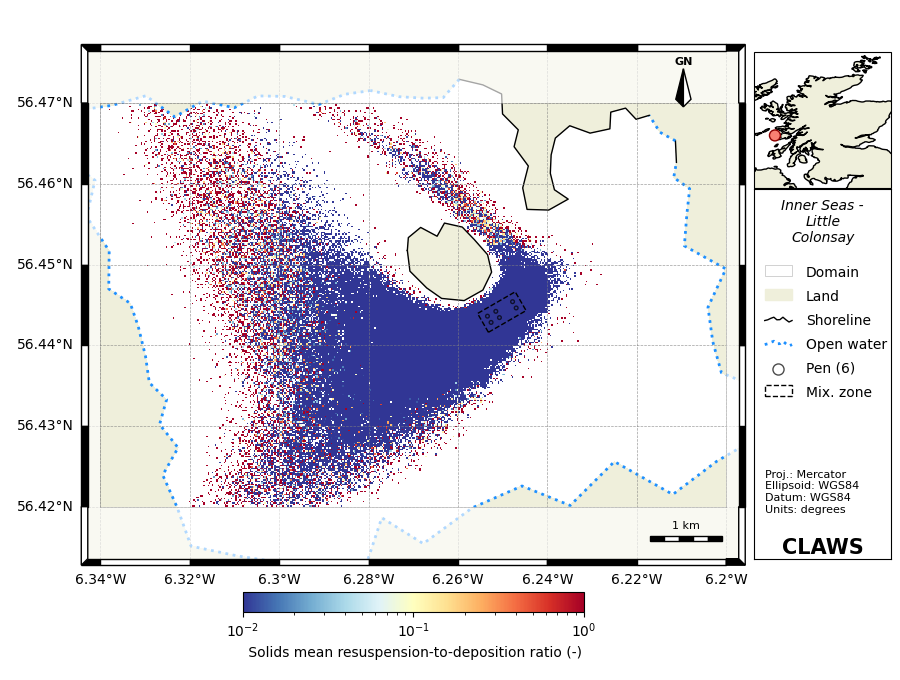
Solids mean resuspension-to-deposition ratio for the proposed farm at Little Colonsay. Values correspond to the average over 90-days from 1st March - 31st May 2019. [PDF→]
Video gallery